Sonnentag Sustainability Display
Immersive exploration of sustainability design for Sonnentag Event Center
- Role Creative director and lead designer for experience
- My focus UI/UX, Data visualization, touchscreen design, strategy and 3D design
- Client University of Wisconsin-Eau Claire
- Time 4 months
The Project
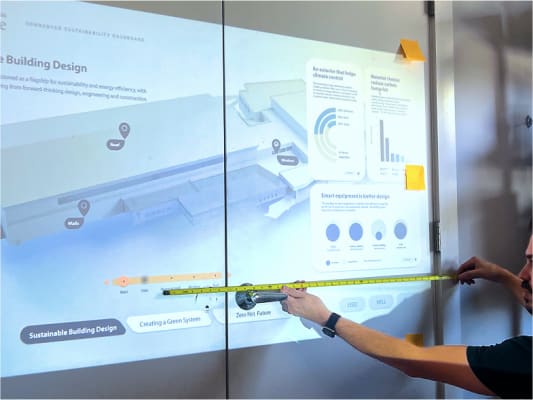
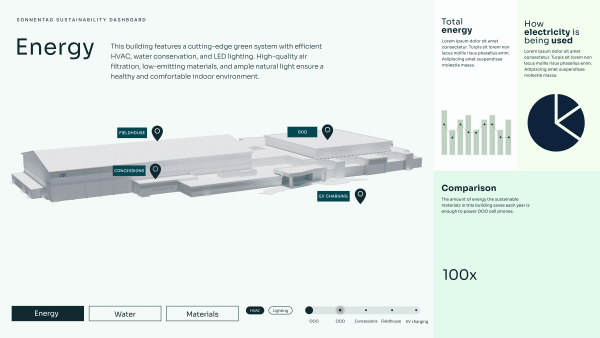
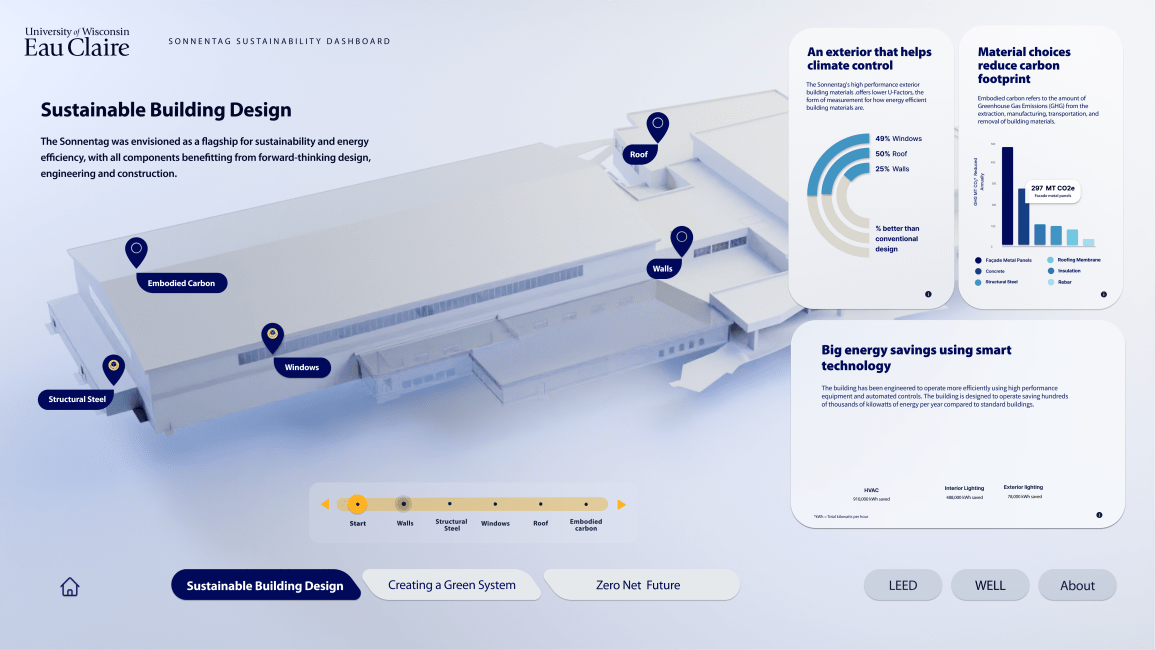
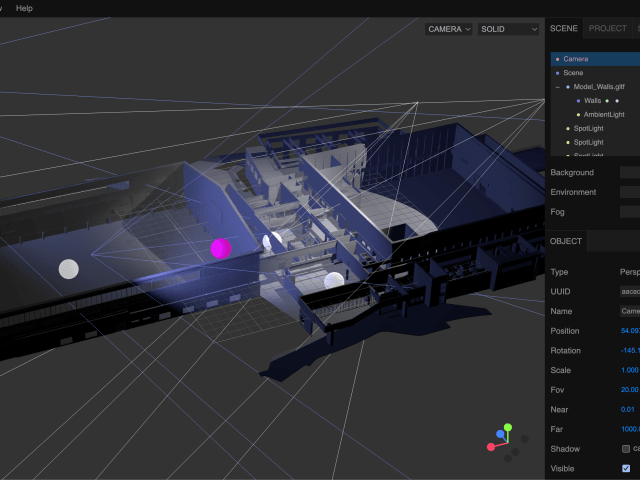
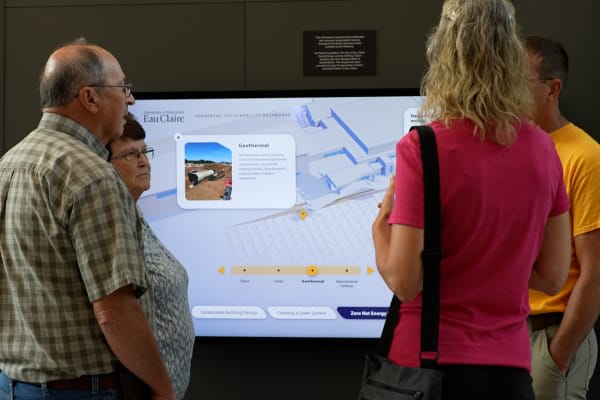
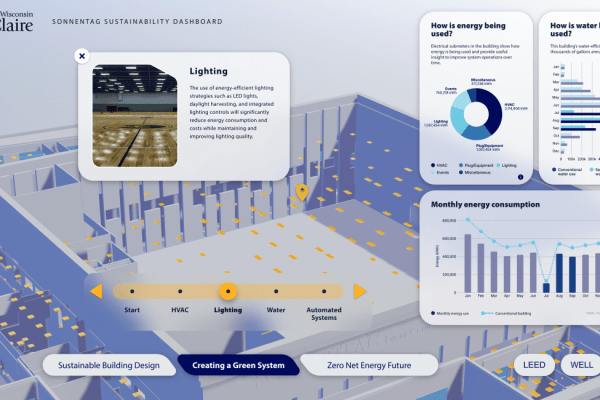
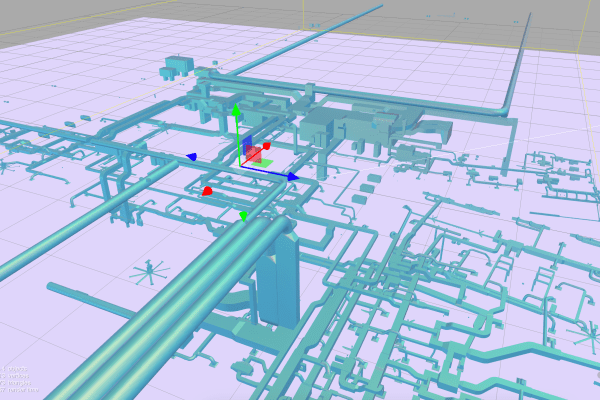
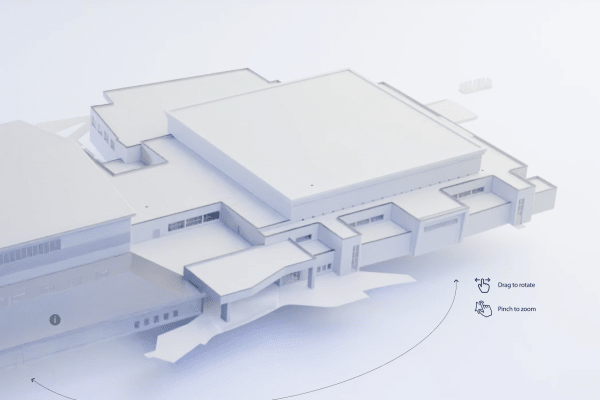
A permanent interactive 3D touchscreen built for the Sonnentag Event Center at UW–Eau Claire, this installation visualizes the building’s green infrastructure and operational performance. Users can explore detailed models of systems like geothermal heating and cooling, structural layers, and energy flow pathways. The interface also integrates live data from the building’s API to display real-time metrics on energy consumption, water use, and system efficiency.
My Role
As Creative Director, I led the project from loose concepts to final delivery. We partnered with the client from day one—before data pipelines or content existed—developing a flexible visualization framework using placeholder data that could scale with future API integration. We developed the project in an agile environment, working side by side with engineers to implement interaction patterns for touchscreen, use their Revit models, and implement live data.
Challenges
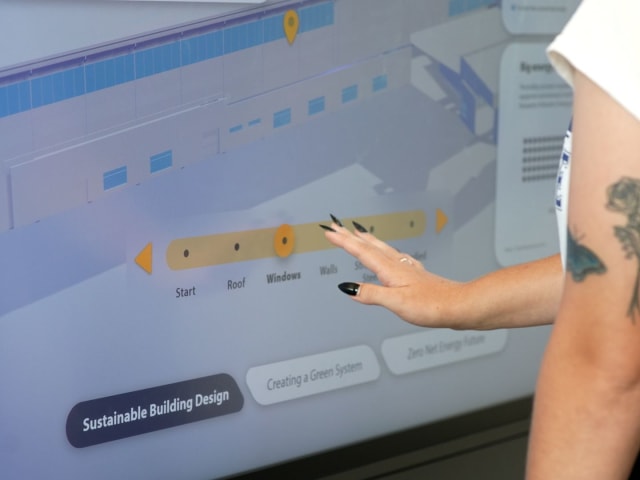
- Build an accessible, interaction touchscreen with live data exploring the event center’s state of the art design
- Accommodate people with visual disabilities and people in wheelchairs
- Design a live data interface before data was collected (since the building was still in construction)
- Build an in-depth exploration of the design that was friendly to all age groups and visitors